The improved availability and capacity will more than pay for the additional cost and provide the best value.
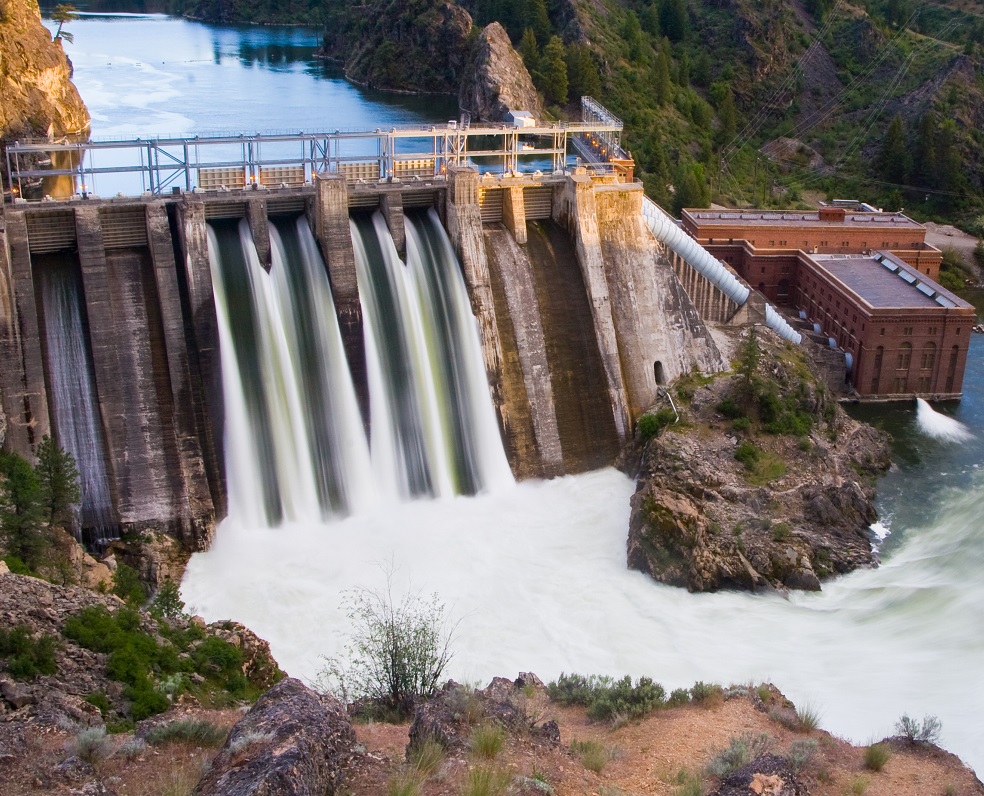
Little Falls Hydro Electric Development was completed and put into operation by Avista Utilities (then Washington Water Power) in 1910. The plant is the last hydro project on the Spokane River and is just upstream from the Columbia River's Lake Roosevelt (Grand Coulee). Little Falls is a run of river type of plant with the flow regulated by the upstream dams at Long Lake. The project has water rights to 7500 cfs. The power plant at Little Falls has a generating capacity of 36 MVA using four 9 MVA generators at 4 kV with double horizontal Francis turbines.
The Problem
Much of the plant equipment is the original installed equipment. Two of the original four turbine runners continue to operate today. The generator exciters are the original DC generators with an amplidyne control system installed in the 1940's replace a manual control system. The generators were last rewound between 1956 and 1968. Three of the four generator governors use a customized Distributed Control System (DCS) and limitorque's to drive the wicket gates installed around 1989. Recent work included replacing 2 of the original turbine runners in 1999 and 2001 and upgrading one generator's governor system to a Woodward 505H system. Much of the remaining equipment is the original plant equipment.
Given the age of the equipment, pressures on energy prices and the growing importance of renewable energy, the question becomes what is the right amount of maintenance and when should equipment be replaced going forward.
Since Avista is an integrated and regulated utility, the business case we selected was to maximize the value of Little Falls for our customers.
While this may seem as a simple and obvious choice, it is not necessarily the lowest budget option for the generation group. Decisions are not always that simple, so the ultimate decision will have to weigh other factors such as initial rate pressure, public perception, and budget constraints into the ultimate decision.
While the business case is to maximize the value to our customers, how that value is determined comes from looking at the costs to perform planned and unplanned work, cost of purchasing replacement power, and impacts to plant capacity.
The Solution
The software used to develop the model is called Availability Workbench developed by Isograph Ltd. Figure 2 shows the inputs into the model and represents the general steps taken to develop the model. The process starts with a team that represents a slice of the organization responsible for an asset. Our team included Mechanical and Electrical Foremen, a Generation Engineer, a Maintenance Manager, our Chief Generation Engineer, Operators, and a Plant Specialist.
The next piece in the process was to structure the model into a reliability block diagram. The diagram represents how the failure of a system or component affects the output of the plant by showing how much capacity is impacted. The reliability block diagram resembles a one-line diagram but has some differences. If a component's failure will cause a complete shutdown of the facility, its block will be in series with all of the other blocks. If a component's failure only reduces the plant's output, its block will be in parallel with other blocks representing the remaining plant capacity.
One of the biggest challenges of the model was the data or lack of data. We assembled industry data, internal data, and any other sources of information to help us define the failure characteristics of each system and component, consequences of failure, costs and resources associated with fixing and maintaining components, and other detailed information. Many times the data simply did not exist or the existing information did not match what we had observed for our systems, so we conducted sessions with foremen, engineers, and managers to fill in the missing information based on their experience.
With all the data and opinions of the internal experts, we then generated a failure model that represented the future probability of equipment failing, the consequences of those failures, and the resources required to repair the failure (called corrective maintenance). This model became the base case and provides the foundation for comparing all other options. This base case model was reviewed with the team to make sure that the model output data fit with the actual plant data. Ensuring the model output makes sense is an important step and vital for the model to be believable. The results must make sense and match what is currently observed before those making the decision can act on the information provided by the model.
As part of the failure model and corrective maintenance, the consequences outside of the cost to fix the equipment was tied to the plant or system as appropriate. This included plant capacity effects for Little Falls that represented the cost of lost generation and subsequent power purchases if the plant capacity did not match the available water to generate power. A few components did have other costs or consequences associated with them such as environmental, safety, operational, and other financial impacts includes but were not used in this model.
The base case provided us the reference point to compare other planned activities. We then modeled different planned maintenance activities such as time based or condition based replacement or refurbishment. The planned maintenance will either make the component like new or extend the life of the system by some interval of time. The modeling tool has the capability to optimize maintenance intervals for time based or condition based maintenance to yield the best cost/benefit ratio or plant availability. If the cost of the planned maintenance exceeds the cost of running equipment to failure, the model will recommend running to failure, and since cost was used to optimize the planned maintenance, several components optimized as run to failure instead of planned maintenance.
Inspections represent a slightly different form of planned maintenance, because they do not extend the life a component nor make it like new.
Inspections were one method to identify potential future failures or conditions that would initiate a planned maintenance to correct the condition before it failed. To account for the future prediction nature of inspections, each inspection requires a probability that the inspection will actually detect a future failure and identify the lead time we have to correct the condition.
Another subset of Inspections was monitoring systems that act just like an Inspection. Monitoring systems perform automated inspections by measuring component values and identify when indications show a future failure is probable.
For all of the corrective maintenance activities, planned maintenance, inspections and monitoring systems, we assigned all of the specific labor, equipment, and spare parts required. These assignments were very specific by type, quantity available, cost per hour and cost per use, and time required for each activity. If contracts or outside resources were needed, they were included as well.
Two features of AvSim+ are the ability to optimize the number of spares held in inventory and the planned maintenance intervals. These features examine the probability of equipment failure, the cost of failures, cost of planned maintenance, cost of spare parts, delay time in receiving spares or labor response, and the cost of holding onto spare parts to balance these factors and then minimize the overall plant costs. With this feature, we optimized the spares inventory and maintenance intervals used in the Optimized Spares and Maintenance Case.
The Outcome
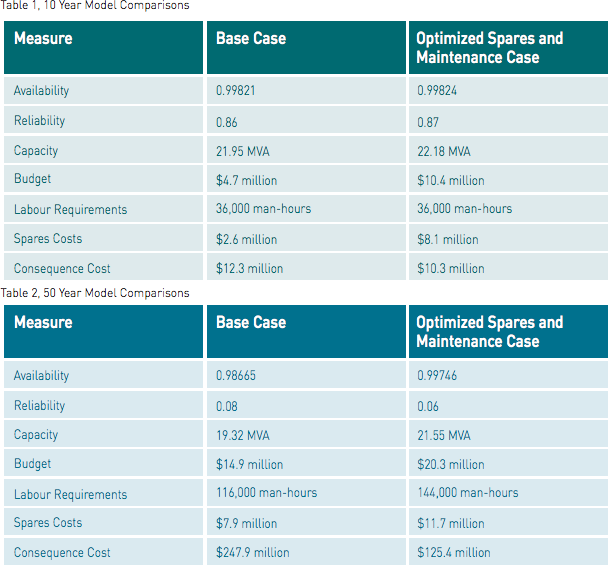
While the model provided detailed information and analysis, the outcome of the analysis depended upon the business goals or what we were trying to accomplish with Little Falls maintenance. In Asset Management, we optimize the value of the plant to our customers, shareholders, and employees. Since this case is a high level model, we examined the overall system results for availability, reliability, capacity, budget, and internal rate of return using the revenue resource requirements. The Little Falls model results were analyzed for a 50 year and 10 year time frame. Table 1 shows some of the projected results for the next 10 years and Table 2 shows the projected results for the next 50 years. Examining Table 1, we see how the options are nearly identical in many ways except for the budget required, because the optimized case recommended significant spare purchases. When we examine Table 2, the picture for the plant changes significantly. In Table 2, the impacts of outages in the Base Case become significant and begin to reduce the overall availability and the average capacity of the Little Falls plant.
Besides the tangible benefits listed above, additional fringe benefits arose as a result of involving the operation and maintenance teams early in the process. The personnel gained an early understanding of the equipment and processes they would eventually be in control of. In addition to this, it also gave them the opportunity to meet and become familiar with some of the equipment suppliers and representatives, helping to build the relationships that are essential to reliable plant operation.
This reduced capacity drives the consequence costs up and show the benefits of the Optimized Spares and Maintenance Case.
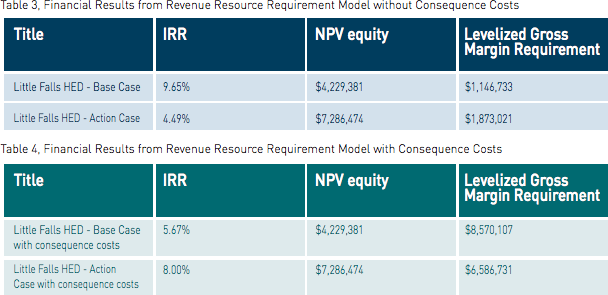
The corresponding financial analysis results shown in Table 3 and Table 4 for the internal rate of return, net present value of the equity, and the levelized gross margin requirement (levelized gross margin requirement represents an average annual payment our customers will have to make to cover this option) demonstrate how the company and customers will be impacted over the next 50 years. Table 3 shows the financial results when excluding the consequence costs associated with outages and Table 4 shows the financial results when the consequence costs are included in the financial analysis.
In examining Table 3, we see how a business strategy of minimizing cost of generation does keep the generation budget lower than the Optimized Spares and Maintenance Case and lowers the cost of generating power internal to the company. The Base Case option has a lower budget because it purchases fewer spares and performs less maintenance. However, Table 4 shows what the actual impact to the customer would be. The Optimized Spares and Maintenance Case purchases large and expensive spares with a long lead time and performs more maintenance than the Base Case. The additional spares and maintenance in turn improves the average capacity of the plant.
Model Analysis
When you ignore the consequence cost of the lost generation or take a shorter term view of Little Falls, the Base Case is clearly the best option. The Base Case over the next 10 years shown in Table 1 illustrates that any changes to our current maintenance practices have very little effect on the performance of the plant. If we ignore the consequence cost associated with the lost generation, Table 3 shows our Base Case performs better financially than any changes to our current practices. From this perspective, it is easy to see why we have operated our plant this way. The generation budgets are kept low and plant performance is insignificantly impacted in the short term.
Now when we include the consequence costs in the analysis and examine the plant over a 50 year interval, our answer changes. The budget for maintaining the plant shown in Table 2 increases by $15.4 million but saves $124.5 million in power purchases or opportunity costs for our customers. The optimized case improves the average capacity of the plant and makes the $124.5 million in savings possible. With the consequence costs included, Table 4 shows the optimized case yields a better internal rate of return by 2.33%; saves our customers effectively $2 million per year on average over 50 years; and improves the equity of the company by $3 million. The optimized case will create some initial rate pressure upwards to cover the initial spares purchase of $8.1 million and after specific portions of the plant are replaced, but our customers will see savings from less power purchased from more expensive sources when the plant is unable to supply customer's needs.
The model analysis for Little Falls showed continuing with our current maintenance and inspection program was the best approach in the short term, but major equipment replacements should be planned for around 2020. The model also indicated that key spare parts worth $5.75 million should be purchased now to reduce outage time if they should fail before 2020.
"The ARMS Reliability team liaised with suppliers, operations and project team members in order to develop the reliability models, maintenance strategies and projected spares requirements; and to create a first pass forecast of maintenance costs for the project."
Now, Avista Utilities' processing plant is ready for anything. Their operations and maintenance teams can continually build on these maintenance strategies using live data - to continuously improve and enhance them, and greatly improve the overall performance of the plant.

Questions? We'll put you on the right path.
Talk to us about our Maintenance Strategy Optimization services and technical solutions. We are ready to help.
Contact Us