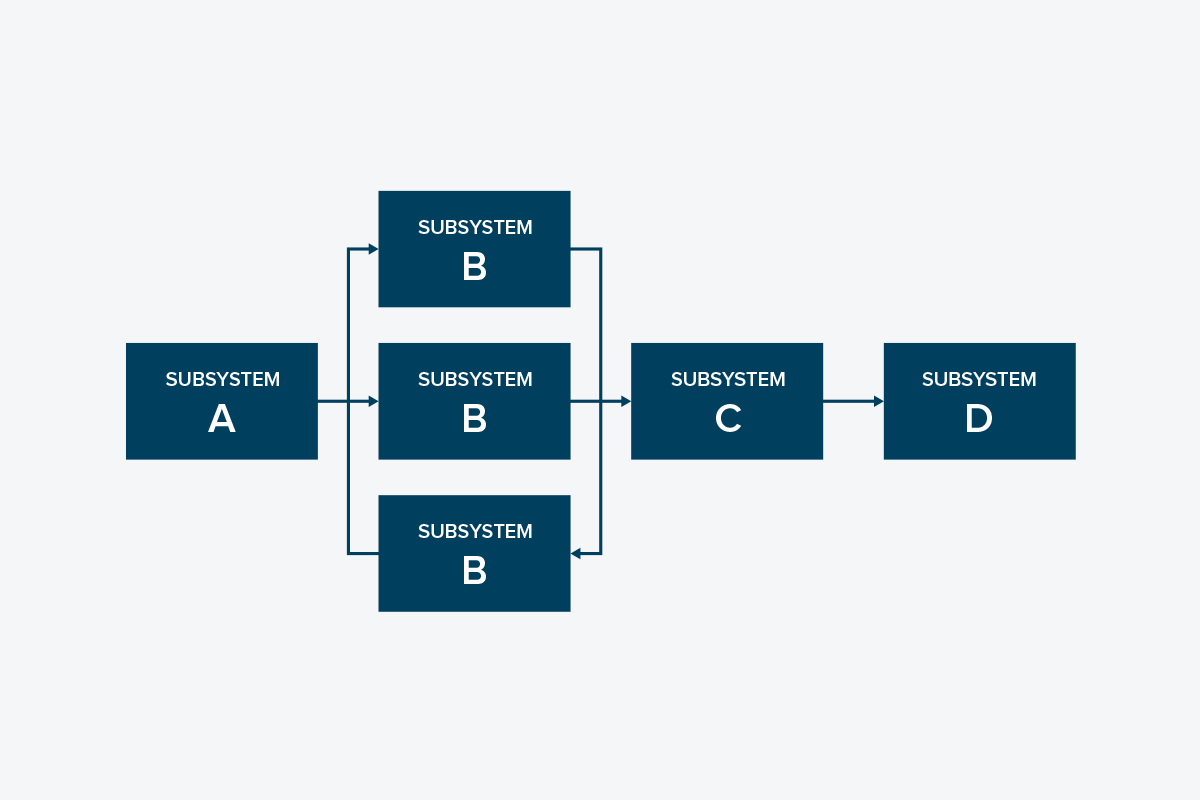
Reliability Block Diagrams (RBDs) are a way of representing a system, including its subsystems and components, as a series of blocks in such a way that equipment failure rates, operating philosophies, and maintenance strategies can be quantitatively assessed in terms of the impact they are expected to have on system performance.
I was introduced to Reliability Block Diagrams while preparing for my Certified Reliability Engineer exam, but it wasn’t until a couple of years following the attainment of that certification that I would be able to progress from theory to practical application by developing RBDs for systems in industries as varied as power generation, downstream petrochemical, mineral processing, conventional oil production, fracking, and liquid natural gas processing. Working hands-on with RBDs, unsurprisingly, yielded some incredible insights about how valuable these diagrams can be.
Projected Performance Levels
The primary output of a Reliability Block Diagram is a projected performance level of a system and all constituent subsystems and assets for a given period of time under specific operating assumptions. How confident you will be in these projections, as with all mathematical models, correlates with the level of accuracy and complexity incorporated into the model, and what assumptions are made during the model’s creation. As a general rule, more complex models may be more accurate, but subjectively, confidence may decrease due to the high number of assumptions that are made. It is here where using a software specifically built to develop RBDs displays its greatest advantage over modeling a system by hand or in a spreadsheet as increased levels of complexity are supported. While it may be convenient to create an RBD in a series of spreadsheets, it can easily become overwhelming as more information is considered. A built-for-purpose software platform will have fields built for nearly every parameter you can think of and more, including: maintenance events, spares logistics, labor availability, equipment rental costs, downtime effects, and more.
Identification of Bottlenecks and Low Hanging Fruit
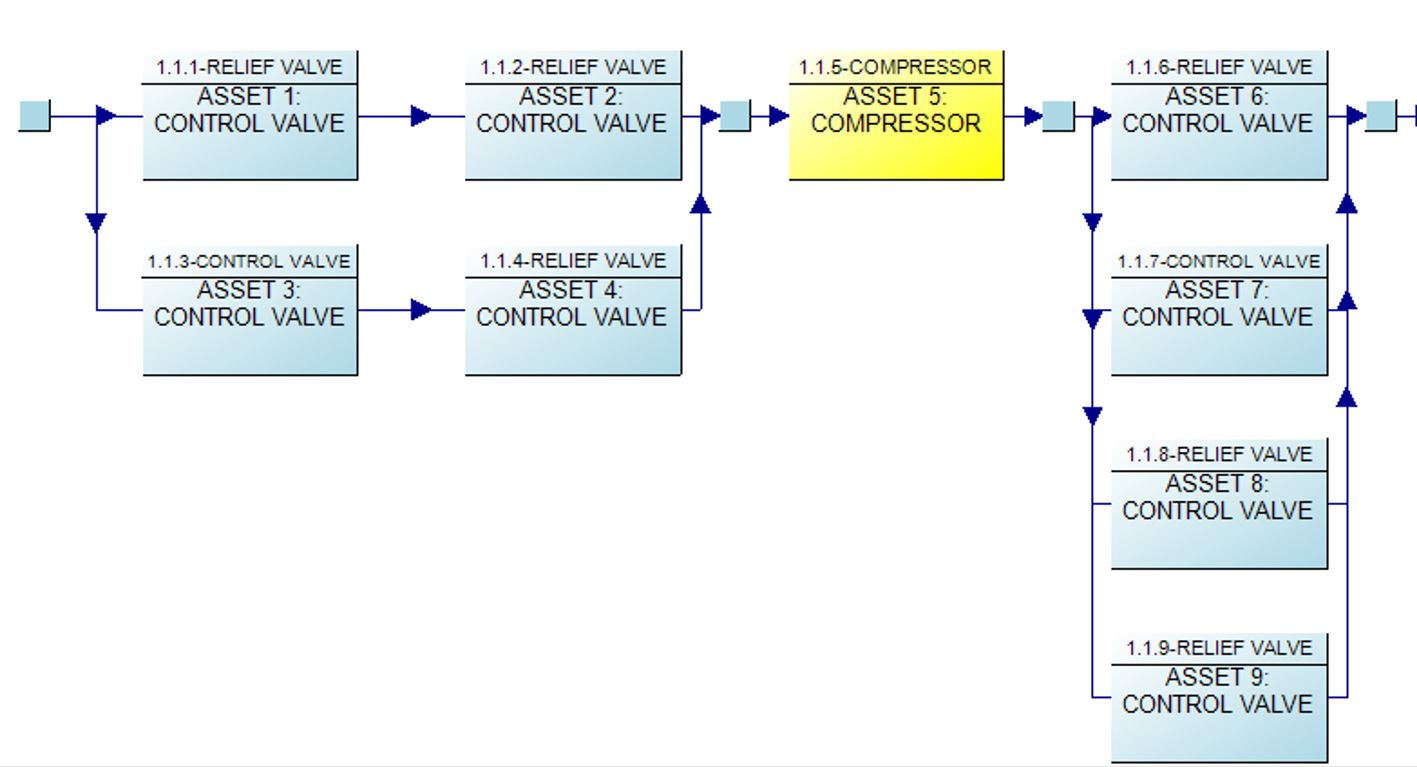
The secondary output of a Reliability Block Diagram is a quantitative indication of which assets are the biggest risk to the sub-system they are located in, and the system in its entirety, for the period under consideration given the assumptions of the model. This means, not only do you know which areas of your plant are likely to be the most problematic, but also which assets are causing these issues, and how the frequency and duration of issues created by each asset compares to all others in the model.
Reviewing this list of the most problematic few, typically identifies not only specific assets that are single points of failure (whenever compressor “A” fails the entire plant is unavailable for an unacceptable amount of time), but also systemic issues (8 of the top 20 contributors to unavailability are control valves).
Quantitative Risk Analysis (Scenarios)
Probably the best-known benefit of creating a Reliability Block Diagram is the ability to analyze the effect different changes may have on a system. These scenarios can be analyzed at any point in the system’s operating life in order to determine how effective different modifications might be at changing the system performance in the manner desired. This can include changes to maintenance strategies (including extending maintenance intervals), spare holding levels, asset redundancies, changes in system or asset loading and operation, and changes in resourcing (hiring vs. using contractors, owning vs. renting high cost equipment), and more. Because each scenario generates a set of quantitative performance data, each scenario can be compared individually or in combination with other scenarios to the current version of the system, identifying the best modifications to adopt in order to improve system performance.
Simplification of a Complicated Process
One of the great strengths of Reliability Block Diagrams is their ability to simplify incredibly complex systems into more digestible segments. The model can be constructed with the level of granularity required of the results and structured to capture the asset redundancies and dependencies that impact the successful operation of the system. When representing a process in this way it becomes much easier to identify how processes interact and explain the relationships between different parts of the process to those unfamiliar with the system. Young engineers, managers moved into new functional areas, and even subject matter experts from different sites can gain and understanding of the process covered during the development of the RBD.
Debugging Master Data
Inevitably while constructing a Reliability Block Diagram, a discrepancy will be identified in the data being relied upon to create the model. Assets may have variations of the same nomenclature applied, have conflicting or erroneous identification information, or may only appear on one data source and not in others. Even with a dedicated master data team in place, it is not uncommon for some data issues to remain under the radar until going through equipment data with a fine-toothed comb as you do when drafting an RBD. In addition to identifying master data issues, developing a Reliability Block Diagram provides the opportunity to confirm spares logistics challenges and risks with your organization’s supply chain. These can include determining how many of each spare is kept in stock, what the lead time is for each spare, and whether that lead time varies when pulling from a central warehouse, a vendor, or the original equipment manufacturer. Similar parameters can be reviewed for labor (how many electricians are currently available?), and equipment (how many mobile cranes are available?).
Confirmation of Asset Statuses
Development of an RBD also provides the opportunity to confirm that all of the assets required for a process to work correctly are present, functional, and meet any guidelines set out by any applicable governing bodies. Is that asset still there? When was it last operated? Was it modified at one point in order to respond to an emergency? Were as-built drawings made of the modifications? Has the asset been certified or tested as required? Has the asset been robbed of parts in order to sustain a different asset on site? Has the asset been mothballed in practice but not identified as such in the CMMS? How does the current state of the asset limit the performance capability of the system overall?
Confirmation of Operational Limits and Requirements
Some assets, if they were to fail, would not affect the performance of the plant. Others may cause a prolonged reduction in production capacity, but the plant would continue to operate. Still others may cause the plant to shutdown immediately. And still other assets may, at the discretion of the operator, be permitted to exist in a failed state for a specific period of time before production would be impacted at all. One of the benefits of developing an RBD is capturing and formalizing these limitations and operational choices. While an asset’s failure may not directly impact production, there may be a limit in place by a governing body on how long that asset may be permitted to be unavailable during operation. Work-arounds can also be identified and their process effects, safety implications, and operational risk level confirmed.
Gap Identification / Parking Lot Items
One of the unsung heroes of trapping your area specialists and subject matter experts in a room for a week to discuss the plant’s processes during Reliability Block Diagram validation is the identification of other opportunities to improve, and capturing those opportunities on a “parking lot” list to follow up on later. Realizing that a shared piece of equipment hasn’t been maintained in the recent past because each party thought it was the other’s responsibility to maintain it is a good example. Another example is finding gaps in how the organization has responded, or plans to respond, or hasn’t (yet) planned to respond, in the event of the failure of each asset included in the analysis.
Relationship Development
It is not uncommon as organizations grow in complexity to compartmentalize functions and develop teams of people highly skilled and fluent in the challenges facing their specific portion of the production process. Calling on resources from multiple departments to contribute to the development of a Reliability Block Diagram provides a common ground to share expertise, experience, and perspective in the context of a shared outcome. As even the most introverted team member will be called upon to share their perspective with the team, the RBD development exercise is a great opportunity for coworkers who would rarely cross paths or be able to draw on each other’s skills and foster interdepartmental connections.
Support a Reliability Culture
While you could argue a wide variety of platforms could be used to show off the skills and value of the reliability department, Reliability Block Diagram development is unique in the breadth of maintenance and reliability knowledge that needs to be brought to the table for a high quality end result. The RBD development process can be used to show the value of collecting failure data and maintaining maintenance records, of leveraging CMMS information to correlate variables (like annual production cycles, and how they are impacted by the local climate), and of having performed Root Cause Analyses (RCAs) in order to prevent failures from reoccurring.
In conclusion, always remember there are both technical and non-technical benefits of developing a Reliability Block Diagram for your system. The RBD is a snapshot of the time when it was constructed – what assets were present, how the system was operated, and what constraints the system operated within.
This provides a useful benchmark to refer to when looking back at how your system used to perform, and whether your system’s current performance lives up to the expectations you had based on the model you created.
Availability Workbench™, Reliability Workbench™, FaultTree+™, and Hazop+™ are trademarks of Isograph Limited, the author and owner of products bearing these marks. ARMS Reliability is an authorised distributor of those products, and a trainer in respect of their use.